
Between the Lines: Graphing Paul Thomas Anderson's Network of Collaborators
By Clara Smith
“Want to know the common element for the entire group?… I’ll tell you the answer.”
— Quiz Kid Donnie Smith, Magnolia (1999)
Who makes a movie? The simplest answer is: it’s complicated. Films are often cited to their director, who serves as the public face of the project and plays a central role in shaping its creative vision. It is no surprise, then, that the Paul Thomas Annotated website prioritizes the director as its focus. He is what binds together this corpus of films, bringing his unique style to each one across over twenty years of filmmaking. It is perhaps best to define Paul Thomas Anderson as the creator of these films, but he is not the sole maker.
It takes hundreds of people working together to make a film; and I chose a network graph for this visualization due to the collaborative nature of filmmaking. Weingart (2011) describes networks most simply as “stuff and relationships,” which is quite broad and could describe just about everything in the world. But, he continues, that does not mean that a network is a worthless endeavor, because “representing information as a network implicitly suggests not only that connections matter, but that they are required to understand whatever’s going on.”1 To truly deconstruct films, as we wish to do with Anderson’s filmography, we must examine the work that went into them and give credit to the hundreds of people who contributed to them.
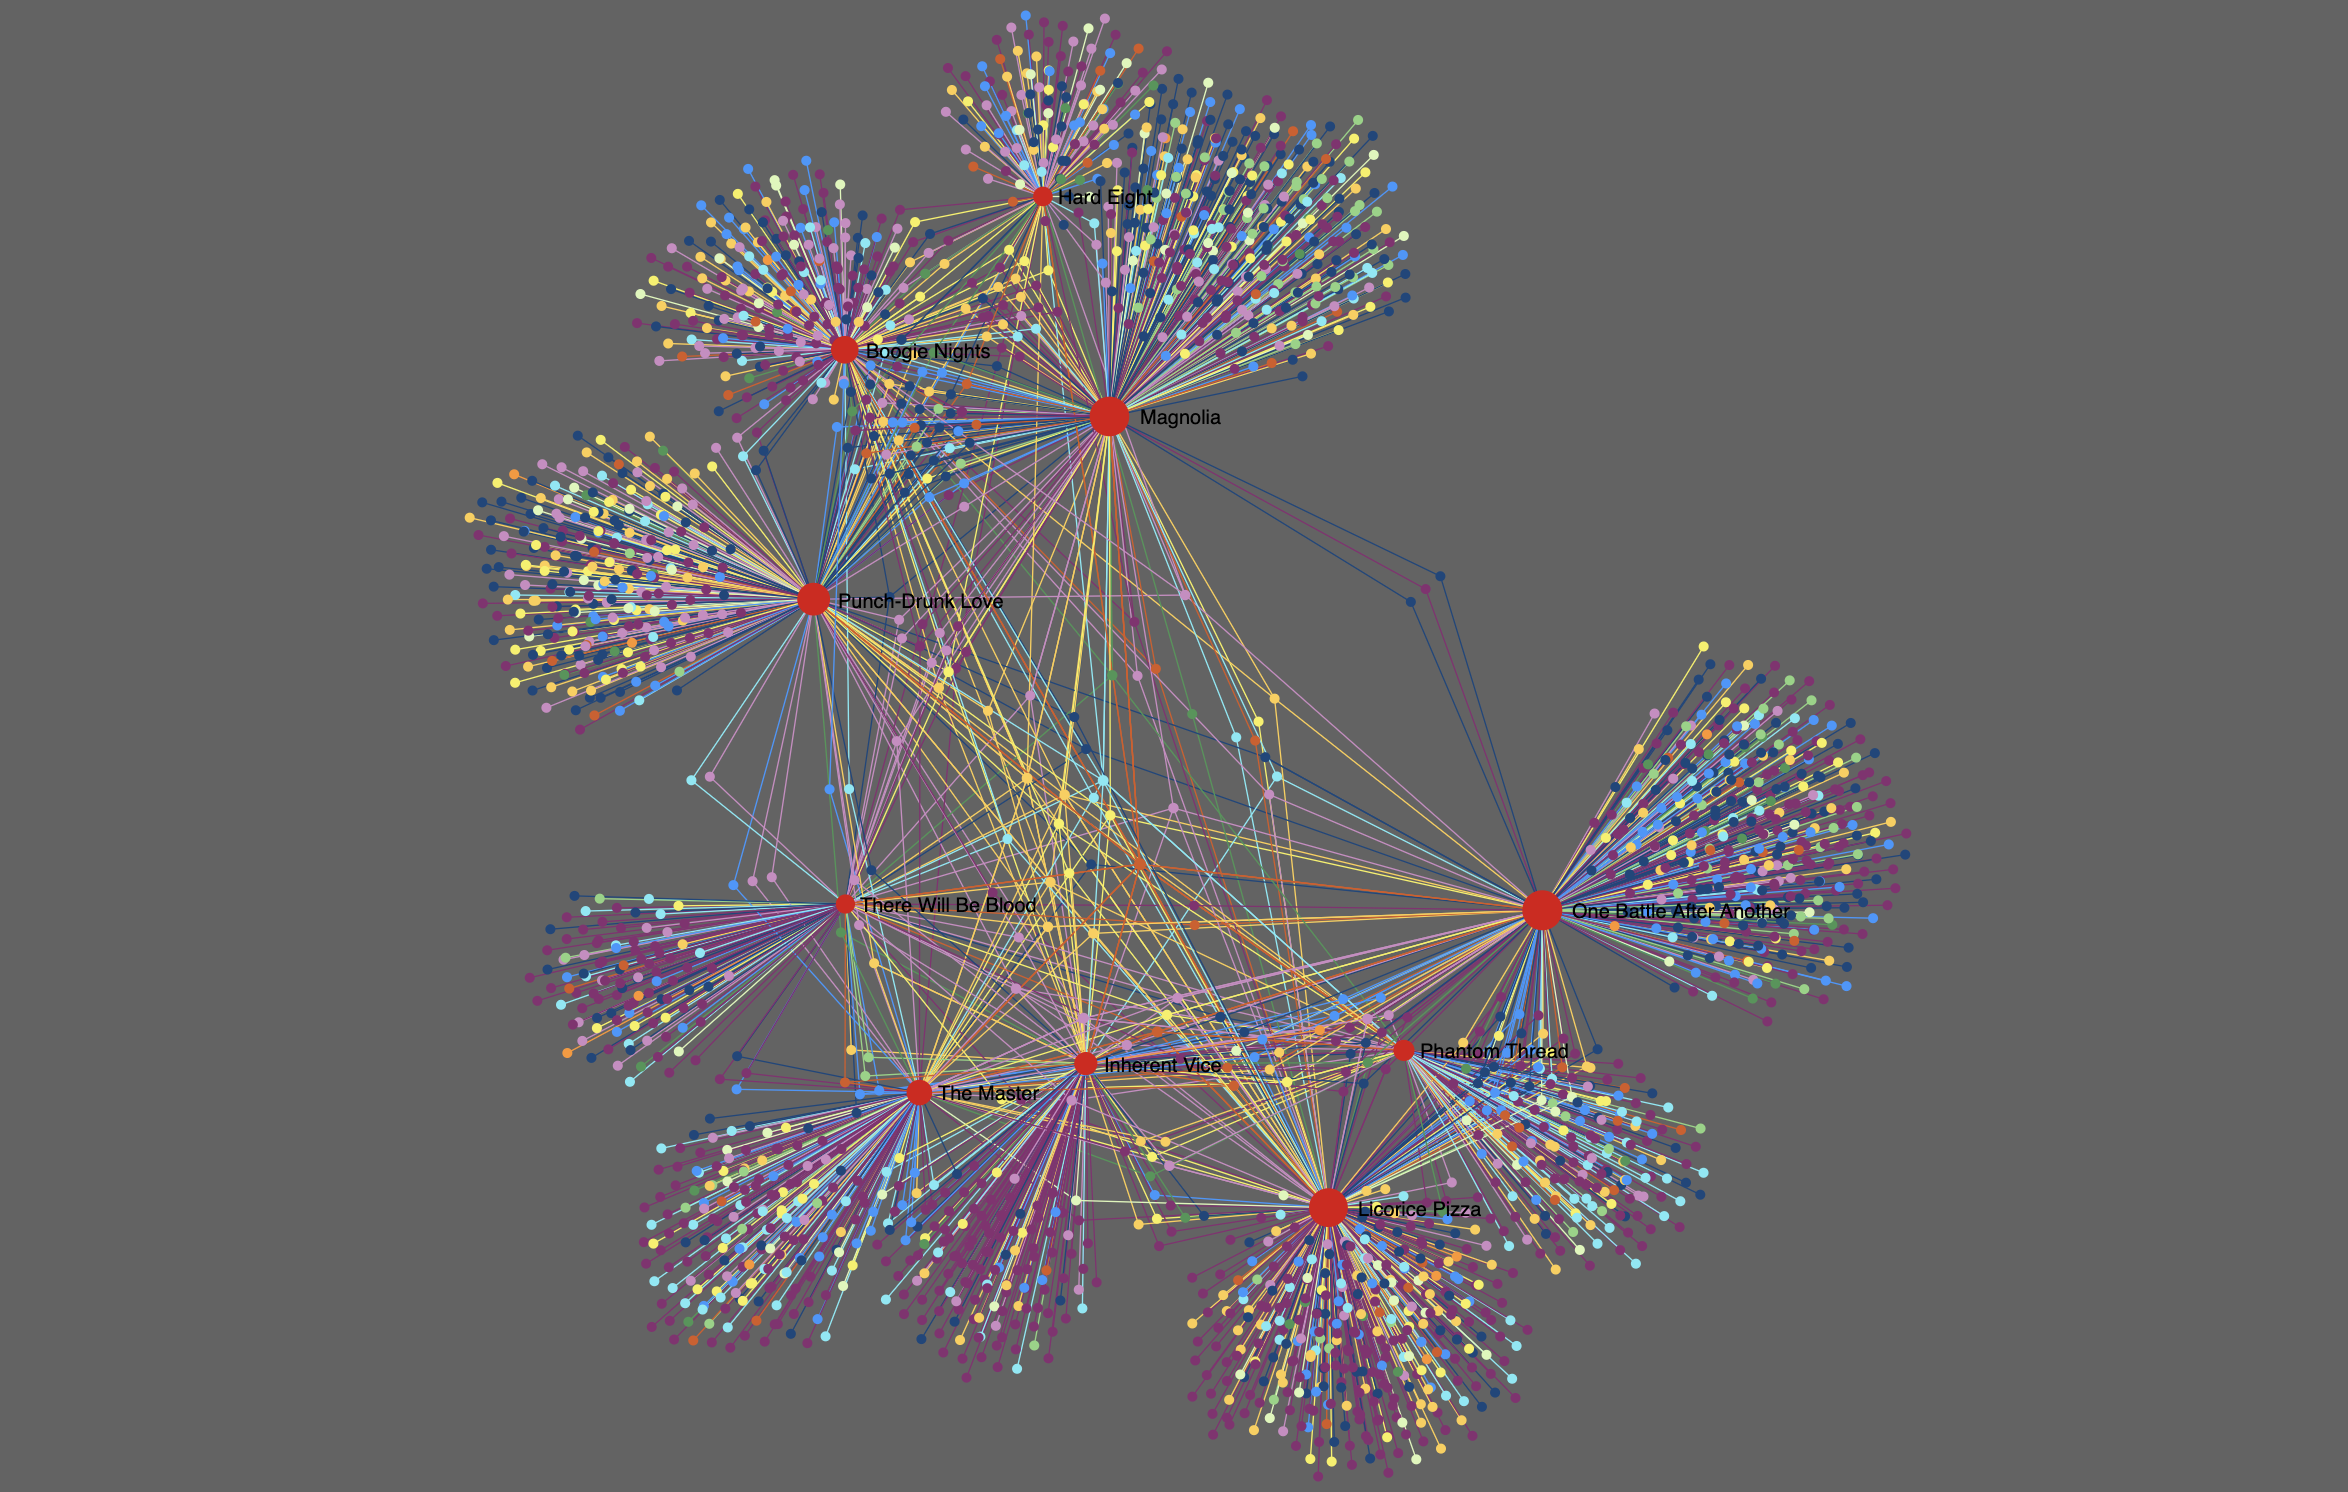
Perhaps it is a coincidence that the graph ended up looking like a flower, but it is difficult not to think of Magnolia (1999), Anderson’s sprawling film about the invisible connections between strangers. Like the film itself, the graph highlights the meaning that emerges when we explore the relationships between individuals.
Collaborative Filmography Network
 Note: For the interactive network graph, please view this page on a desktop computer.
Using the Graph
A network graph is divided into nodes (points) and edges (lines between points). In this graph, people and films are nodes, and edges connect individuals to the films on which they worked. Nodes are color-coded by which department the crew member is most known for (for example, acting, directing, and so on). You can click on any node and it will highlight the connections and pull up information about the individual, such as which films they have worked on and their specific department and role on set. Actors will additionally have their character name. All the jobs someone held on set are listed.
To search for a particular collaborator, one can use the search bar to find them. The graph can be filtered through the group selector (“known for” department) to only see all the nodes of a particular category.
Departments (Based on TMDB)
- Art: in charge of the visual design of the film; positions include set designers, props, painters, etc.
- Crew: While a term for the overall workers on the film, here it serves to categorize any role that does not fit into a specific department. Positions include choreographers, drivers, catering, etc.
- Production: administrative and logistical work; positions include casting, accounting, location coordinators, etc.
- Acting: any performers, from leads, to extras, to voice actors.
- Costume & Make-Up: in charge of the visual design of characters; positions include costume designers, hairstylists, make-up artists, etc.
- Sound: in charge of all auditory aspects of the film; positions include composers, sound mixers, ADR (dubbing), foley artists, etc.
- Camera: in charge of capturing the image of the film; positions include cinematographers, camera operators, grips (equipment technicians), etc.
- Directing: managing the creative vision of the film, aside from the director; positions also include assistant directors (daily logistics) and script supervisors.
- Visual Effects: in charge of the creation and manipulation of any digital imagery; positions include animators, CG artists, compositing artists, etc.
- Lighting: in charge of supplying light for every scene; positions include lighting designers, gaffers, electricians, etc.
- Editing: in charge of the post-production work of assembling shots into a film; aside from editors themselves, positions include colorists, archival footage coordinators, etc.
- Writing: in charge of the creation of the screenplay; may also include the creators of the original concept (e.g. the author of a book adapted by the film).
Analysis
What can we learn from looking at this network graph as a whole? Production size, for example, is based on the number of connected nodes. Films with larger casts and crews appear denser, while the smaller productions occupy less space.
Position within the network is also meaningful. Because the graph uses a force-directed layout—in which nodes connected to each other are drawn together while simultaneously repulsed so they don’t overlap until the graph reaches an equilibrium—collaborators who worked on many films tend to be pulled toward the center. Those who only worked on a single film are towards the outside.
The layout also highlights changes across Anderson’s career. Due to the shared collaborators, his first four feature films (Hard Eight, Boogie Nights, Magnolia, and Punch-Drunk Love) cluster together on one side of the graph, while his later films are on the other. This division reflects a gradual shift in his creative partnerships. Some collaborators define a certain period of his work, such as cinematographer Robert Elswit, who worked on films up until Inherent Vice, or Graeme Stewart, who joined The Master as a music editor and has worked on every film since. Other collaborators remain constant throughout his career and bridge periods, such as Cassandra Kulukundis, who has worked in casting for every film since Boogie Nights (and who won the first ever Academy Award for Best Casting for her work on One Battle After Another).3 With such a varied filmography, Anderson combines a core of long-term collaborators with specialists who join for particular phases of his career or individual projects. This balance allows him to maintain a recognizable creative identity while experimenting with different styles throughout his career.
Coworking Network
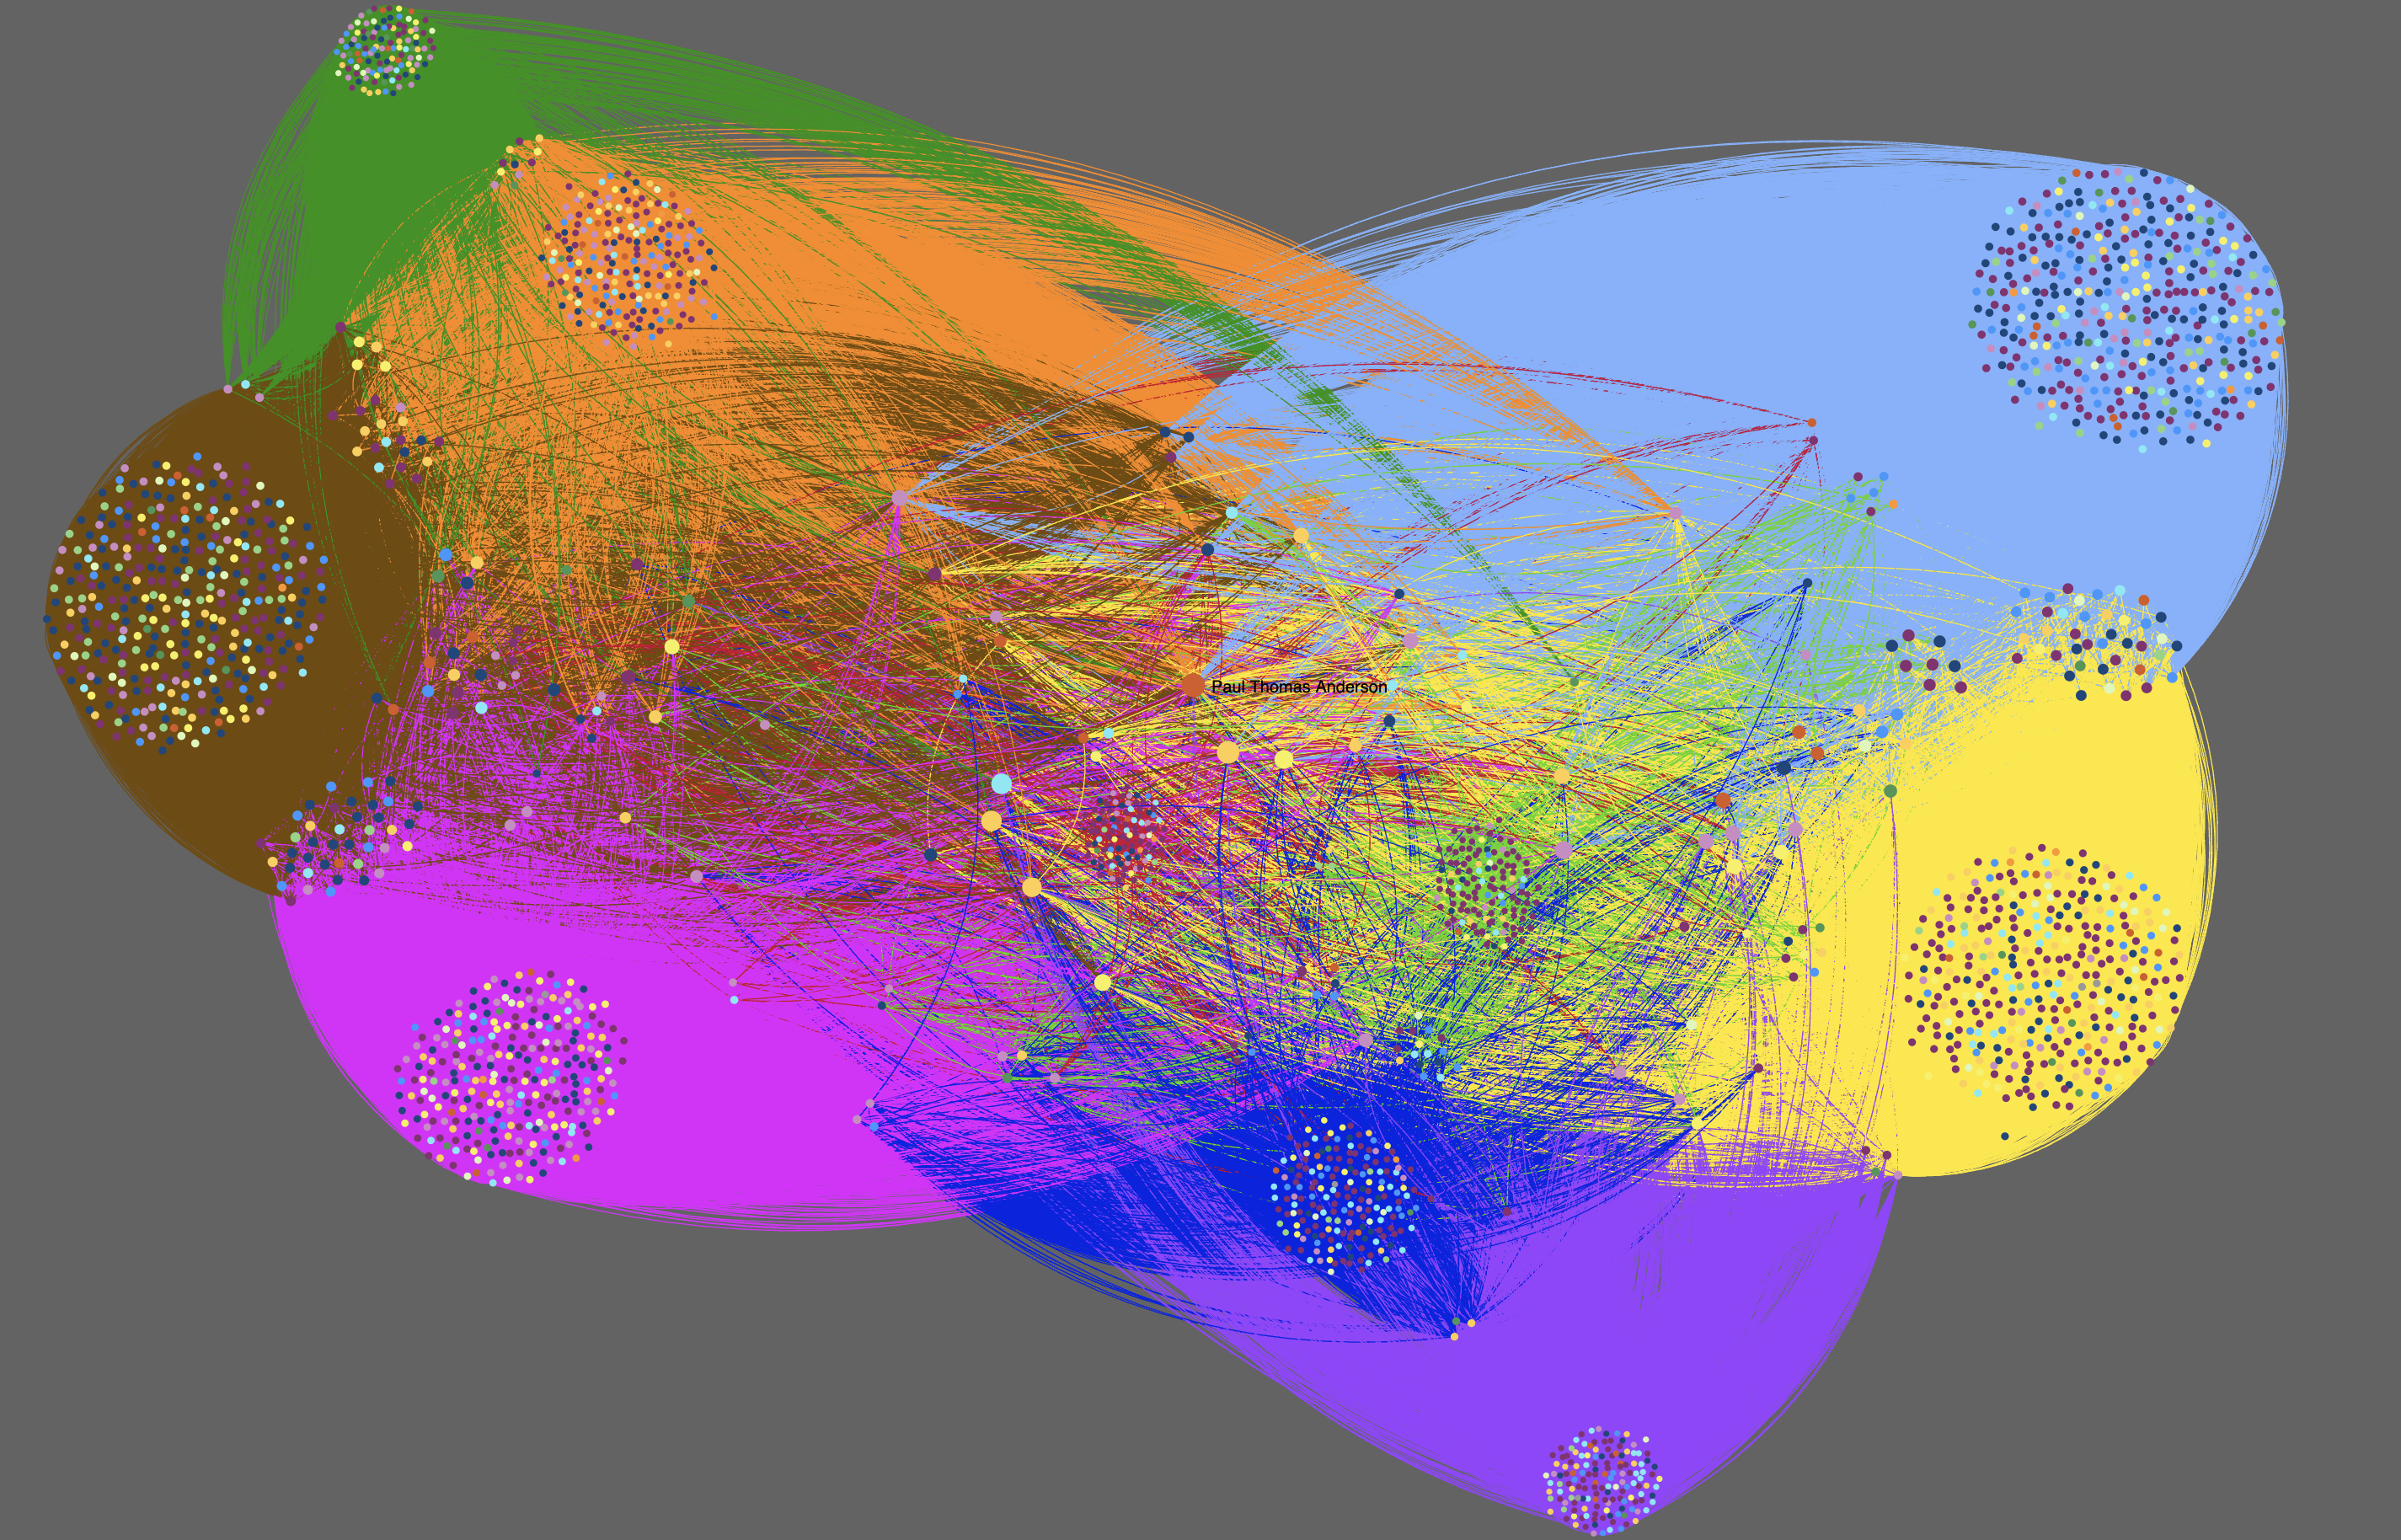
Alongside the main network graph, I created a second visualization that approaches the same data from a more artistic perspective. Rather than connecting collaborators to the films they worked on, this graph connects every person directly to every other cast and crew member with whom they worked on a production.
The color-coding of the nodes remains the same, based on the person’s job. But the color-coding of the edges is based on what film they worked together on. As thousands of overlapping relationships intersect, each production emerges through the density of color. This graph is less concerned with practical use than with revealing the immense scale and interconnectedness of filmmaking. Individual relationships are more difficult to distinguish, but they have a collective effect in creating an abstract portrait of creative labor.
 Note: For the interactive network graph, please view this page on a desktop computer.
Boogie Nights
Hard Eight
Inherent Vice
Licorice Pizza
Magnolia
The Master
One Battle After Another
Phantom Thread
Punch-Drunk Love
There Will Be Blood
Auteurs, Artists, and Anything Between
Building on the ideas of the French New Wave, a film movement that rejected traditional filmmaking, Andrew Sarris introduced the auteur theory to American film theory. This theory posits that the director is the author of a film and has near-complete creative control over their work.5 According to Sarris, not everyone who directs is an auteur, as a true auteur needs both talent and a distinctive personal style. Sarris visualizes the criteria as concentric circles, in which the outer ring is technical competence, the middle ring is distinguishable personality, and the innermost circle is interior meaning (the abstract and intangible heart of a film). The auteur lies at the center of the diagram, having achieved all three levels in their work. Anderson is widely considered one of the greatest modern auteurs; the mere fact that we have created a site dedicated to the meaning and importance of his films indicates our thoughts on his auteur status.
However, auteur theory is not without its critics. Georges Sadoul argues instead that “a film is almost always a collective creation and each collaborator, from the least technician to the most famous star, in small part or large, is one of the authors.”6 Although this project focuses on Anderson, his films are not a product of him alone; they take the work of a great number of people. This feature is not intended to deny Anderson as an auteur, nor declare him as the sole maker, but to understand how auteurship and collaborative work are not irreconcilable concepts. The graph does not seek to decenter Anderson—in fact, quite the opposite, as he is the point through which everything intersects. In an interview, Anderson said that for One Battle After Another he was “working with the most incredible and talented crew…[b]ecause it’s one thing to come up with an idea and tell it, but these people have to execute it…the execution of it is in the hands of some very talented people.” 7
Let’s say a director proposes to use red and blue lighting in a scene to represent the romantic relationship between the two main characters. The director comes up with the idea, but it is the gaffer who implements it. It is up to them to use their expertise to choose which lights, what wattage, what shape and size, whether warm tone or cool tone works best. They must consider the set, the placement of the actors, the cameras that are being used. Once all these decisions are made, the director looks at the lighting, approves, and the production moves on. No one can deny that it is the director’s idea, but it is in collaboration with the rest of the crew. To skip from the director’s vision to their approval is to miss out on the vital labor and the creative work of the crew. This graph seeks to bridge that gap, to draw the line between concept and execution of the films.
One way the film industry formally distinguishes different kinds of labor is through above-the-line and below-the-line workers.8 The distinction is based on the production budget and how the crew will be paid, although it also generally aligns with the type of work being done. Above-the-line are people in creative development, production, direction, and lead actors, who are typically paid a fixed rate for the project and may get residuals. Below-the-line are day-to-day crew members on hourly wages. Ostensibly, the separation is only about the budget and not relative importance of different figures; however, the hierarchical nature of the terms implies a level of superiority.
This visualization proposes another way of thinking about those lines. These lines are not separating people—they’re connecting them. In the words of Anderson, a good film set is “just about organization and communication. You can have fun doing it and be kind and get it done.”9
Methods
The dataset for this graph was gathered using The Movie Database (TMDB) API based on the Credits page. API stands for Application Programming Interface, which allows software to share data with other software. This resource provided JSON files for each of the films that contained the name of every credited cast and crew member along with supplementary information about them. I used OpenRefine and Microsoft Excel to clean and transform the data into edges and nodes. I needed to combine any duplicates of individuals such that every person only appears once but has all of their credited films listed.
Each node is one row in a spreadsheet, which contains identifying information and additional attributes. For each node there is a unique ID based off on the existing IDs that TMDB uses as the API assigns every individual a number. The film’s IDs are consistent with the existing four-letter notation used elsewhere in the PTAnnotated project (e.g. boog for Boogie Nights). Each node also has a label; in this case, it was the name of the collaborator. In a situation where someone goes by a different name than their given name, such as a stage name, the name that they are publicly known by was used for the sake of clarity. Additional attributes were their “known for” department (from the TMDB API, which is based on their most credited role), and their specific departments and roles for each film. Films have attributes for release year and a link to the relevant PTAnnotated film page.
Edges connect a source node (the starting point) to a target node (the end point), so each collaborator is a source and has a directed arrow leading to their targets, which in this instance is the films they worked on. Functionally, this meant a spreadsheet with a column for the sources and a column for the target; if they are in the same row, they are connected. A source can be connected to multiple targets.
Once these spreadsheets were made, I uploaded them to Gephi as CSV files. Gephi is an open source software for creating network graphs, and I used it to generate the graph and customize the layout, sizing, labels, etc.
Once I was satisfied with my graph, I exported it as a graphml file and reuploaded it to Gephi Lite. Gephi Lite is the online browser-based version of Gephi, which allowed for even more customization, such as color organizing through specific hex codes. Gephi Lite also can connect to GitHub as a way to publish public graph files. Since Gephi Lite cannot export interactive graphs, I re-imported my graph back into Gephi. Utilizing the SigmaExport plugin, I exported it as a Sigma.js template. Sigma.js is a JavaScript library for creating interactive network graphs that can be viewed in a browser. The plugin and template were created by the Oxford Internet Institute’s InteractiveVis project. The export files, containing the data and the template for the site, were uploaded into GitHub.
View code and data for this visualization
Limitations
This project faced a great number of hurdles and, as with any visualization, there are drawbacks. TMDB was an enormous resource in this project; however, using a preexisting data set that is community-sourced at such a large quantity means that not every individual is able to be checked for accuracy and there may be discrepancies in name, involvement, or title. In addition, contributors have been grouped by what department they are “known for.” However, this category is based on all of their works and not their specific involvement in PTA films. This has led to a few cases in which someone is known for a department that does not align with their role. For example, Robert Downey Sr., who is listed for directing, had a cameo in two films and had no involvement in the direction. If one were to just look at the graph and the color coding this may be misleading, although the details are clarified in the information panel.
The initial plan was to have an edge for every role a person has fulfilled; however, Gephi cannot support multiple edges between the same two nodes. So, even if someone had multiple jobs on the same film, they will only have one line between them and that film. Additionally, a person can only have one “known for” department, so they cannot be filtered by all of their roles (for instance, Anderson does not appear when filtered for writing, despite having written all his films).
Conclusion
No one person makes a movie. By mapping the hundreds of artists, technicians, performers, and craftspeople who contribute to Anderson’s films, these graphs make visible the network of collaboration. Instead of condensing people in a list of credits, this project envisions an alternative, more interactive mode of attribution. In doing so, it offers another way of reading Anderson’s filmography through the relationships that make auteurship and cinema itself possible. The graph allows the films to be analyzed as more than just the finished texts, as the network constructs the structures through which these films are produced.
The goal of the PTAnnotated project is to break the films down into its smallest elements. This visualization takes a different approach by presenting the individual contribution and the collective simultaneously. By connecting every credit instead of isolating it, we’re reminded that a creative vision only becomes a film through the expertise and work of countless artists.
To understand who makes a movie, sometimes you have to look between the lines.
Bibliography
- Bastian, Mathieu, Sebastien Heymann, and Mathieu Jacomy. “Gephi: An Open Source Software for Exploring and Manipulating Networks.” Proceedings of the International AAAI Conference on Web and Social Media 3, no. 1 (2009): 361–62.
- Heidmann, Patrick. “Paul Thomas Anderson: ‘We Continue to Move Forward.’” The Talks, March 15, 2026. https://the-talks.com/interview/paul-thomas-anderson/.
- Huynh, David. OpenRefine. Version 3.10.1. Code for Science and Society, released 2026. https://openrefine.org/.
- Jacomy, Alexis, and Guillaume Plique. Sigma.Js. Version 1. Released 2014.
. - Oxford Internet Institute. InteractiveVis. Released 2012. https://github.com/oxfordinternetinstitute/InteractiveVis/.
- Pruner, Aaron. “Above-the-Line vs. Below-the-Line Jobs in Film.” Backstage, May 10, 2022. https://www.backstage.com/magazine/article/above-the-line-vs-below-the-line-crew-differences-74969/.
- Remnick, David. “Paul Thomas Anderson on What Makes a Movie Great.” The New Yorker, December 12, 2021. https://www.newyorker.com/culture/the-new-yorker-interview/paul-thomas-anderson-on-what-makes-a-movie-great.
- Sadoul, Georges. Dictionary of Films. Edited by Peter Morris. Berkeley, University of California Press, 1972. http://archive.org/details/bub_gb_PvsZikRu-hAC.
- Sarris, Andrew. “Notes on the Auteur Theory in 1962.” Film Culture, no. 27 (Winter 1962/1963): 1–8. https://dn721605.ca.archive.org/0/items/film-culture-1962-no-27/film-culture-1962-no-27.pdf.
- Tangcay, Jazz. “‘One Battle After Another’ Casting Director Cassandra Kulukundis Wins Inaugural Oscar for Best Casting.” Variety, March 16, 2026. https://variety.com/2026/artisans/news/one-battle-after-another-wins-first-oscar-best-casting-1236680670/.
- The Movie Database. The Movie Database API. Version 3. Released 2026. https://developer.themoviedb.org/docs/getting-started.
- Weingart, Scott B. “Demystifying Networks, Parts I & II.” Journal of Digital Humanities 1, no. 1 (2011). https://journalofdigitalhumanities.org/1-1/demystifying-networks-by-scott-weingart/.
Notes
-
Scott B. Weingart, “Demystifying Networks, Parts I & II,” Journal of Digital Humanities 1, no. 1 (2011), https://journalofdigitalhumanities.org/1-1/demystifying-networks-by-scott-weingart/. ↩
-
This feature uses the TMDB API but is not endorsed or certified by TMDB. ↩
-
Jazz Tangcay, “‘One Battle After Another’ Casting Director Cassandra Kulukundis Wins Inaugural Oscar for Best Casting,” Variety, March 16, 2026, https://variety.com/2026/artisans/news/one-battle-after-another-wins-first-oscar-best-casting-1236680670/. ↩
-
This feature uses the TMDB API but is not endorsed or certified by TMDB. ↩
-
Andrew Sarris, “Notes on the Auteur Theory in 1962,” Film Culture, no. 27 (Winter 1962/1963), 6. ↩
-
Georges Sadoul, Dictionary of Films, ed. Peter Morris (Berkeley, University of California Press, 1972), vi. ↩
-
Patrick Heidmann, “Paul Thomas Anderson: ‘We Continue to Move Forward,’” The Talks, March 15, 2026, https://the-talks.com/interview/paul-thomas-anderson/. ↩
-
Aaron Pruner, “Above-the-Line vs. Below-the-Line Crew,” Backstage, May 10, 2022, https://www.backstage.com/magazine/article/above-the-line-vs-below-the-line-crew-differences-74969/. ↩
-
David Remnick, “Paul Thomas Anderson on What Makes a Movie Great,” The New Yorker, December 12, 2021, https://www.newyorker.com/culture/the-new-yorker-interview/paul-thomas-anderson-on-what-makes-a-movie-great. ↩